Molecular Landscapes by David S. Goodsell
Escherichia coli Bacterium, 2021

Acknowledgement: Illustration by David S. Goodsell, RCSB Protein Data Bank. doi: 10.2210/rcsb_pdb/goodsell-gallery-028
This painting shows a cross-section through an Escherichia coli cell. The characteristic two-membrane cell wall of gram-negative bacteria is shown in green, with many lipopolysaccharide chains extending from the surface and a network of cross-linked peptidoglycan strands between the membranes. The genome of the cell forms a loosely-defined "nucleoid", shown here in yellow, and interacts with many DNA-binding proteins, shown in tan and orange. Large soluble molecules, such as ribosomes (colored in reddish purple), mostly occupy the space around the nucleoid.
This painting is an update of an earlier E. coli painting from 1999, incorporating abundant new data that has been gathered since then, including proteomics information and many amazing new structures. A few notable molecular systems are highlighted here. A pdf document is available for download with a detailed key of the molecules that are depicted in the illustration and information on scientific sources for the structures.
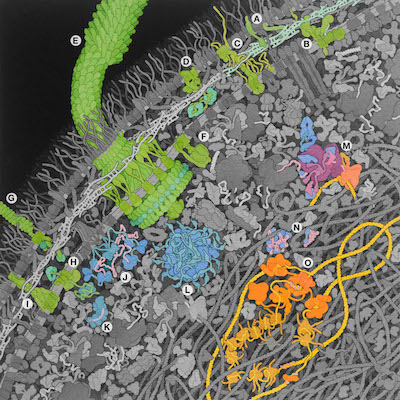
A. Lipoprotein, the most abundant protein in the cell, and OmpA. Two structural proteins that connect the outer membrane and the peptidoglycan network.
B. A complex of proteins that synthesize the peptidoglycan network, including penicillin-binding proteins that are the target of penicillin.
C. The Lpt system that transports lipopolysaccharides from the inner membrane (where they are synthesized) to the outer membrane.
D. The Bam system that chaperones the folding of outer membrane proteins.
E. Flagellum and flagellar motor.
F. ATP synthase.
G. Fimbria and fimbrial usher. One subunit is being transported to the usher by a chaperone.
H. Secretory translocon, being assisted by chaperones.
I. AcrAB/TolC multi-drug efflux pump.
J. Degradosome, a complex of proteins for degrading obsolete RNA.
K. Cascade and CRISPR.
L. Pyruvate dehydrogenase complex.
M. Expressome. The flexible arms on the ribosome are L12 subunits, which help coordinate the binding of tRNA and elongation factors.
N. Two sRNA with their associated proteins.
O. Replisome including several DNA polymerases and single-strand DNA-binding proteins protecting the single-stranded intermediates formed during the process of DNA replication.